Diverse Industries, But One Standard of Excellence.

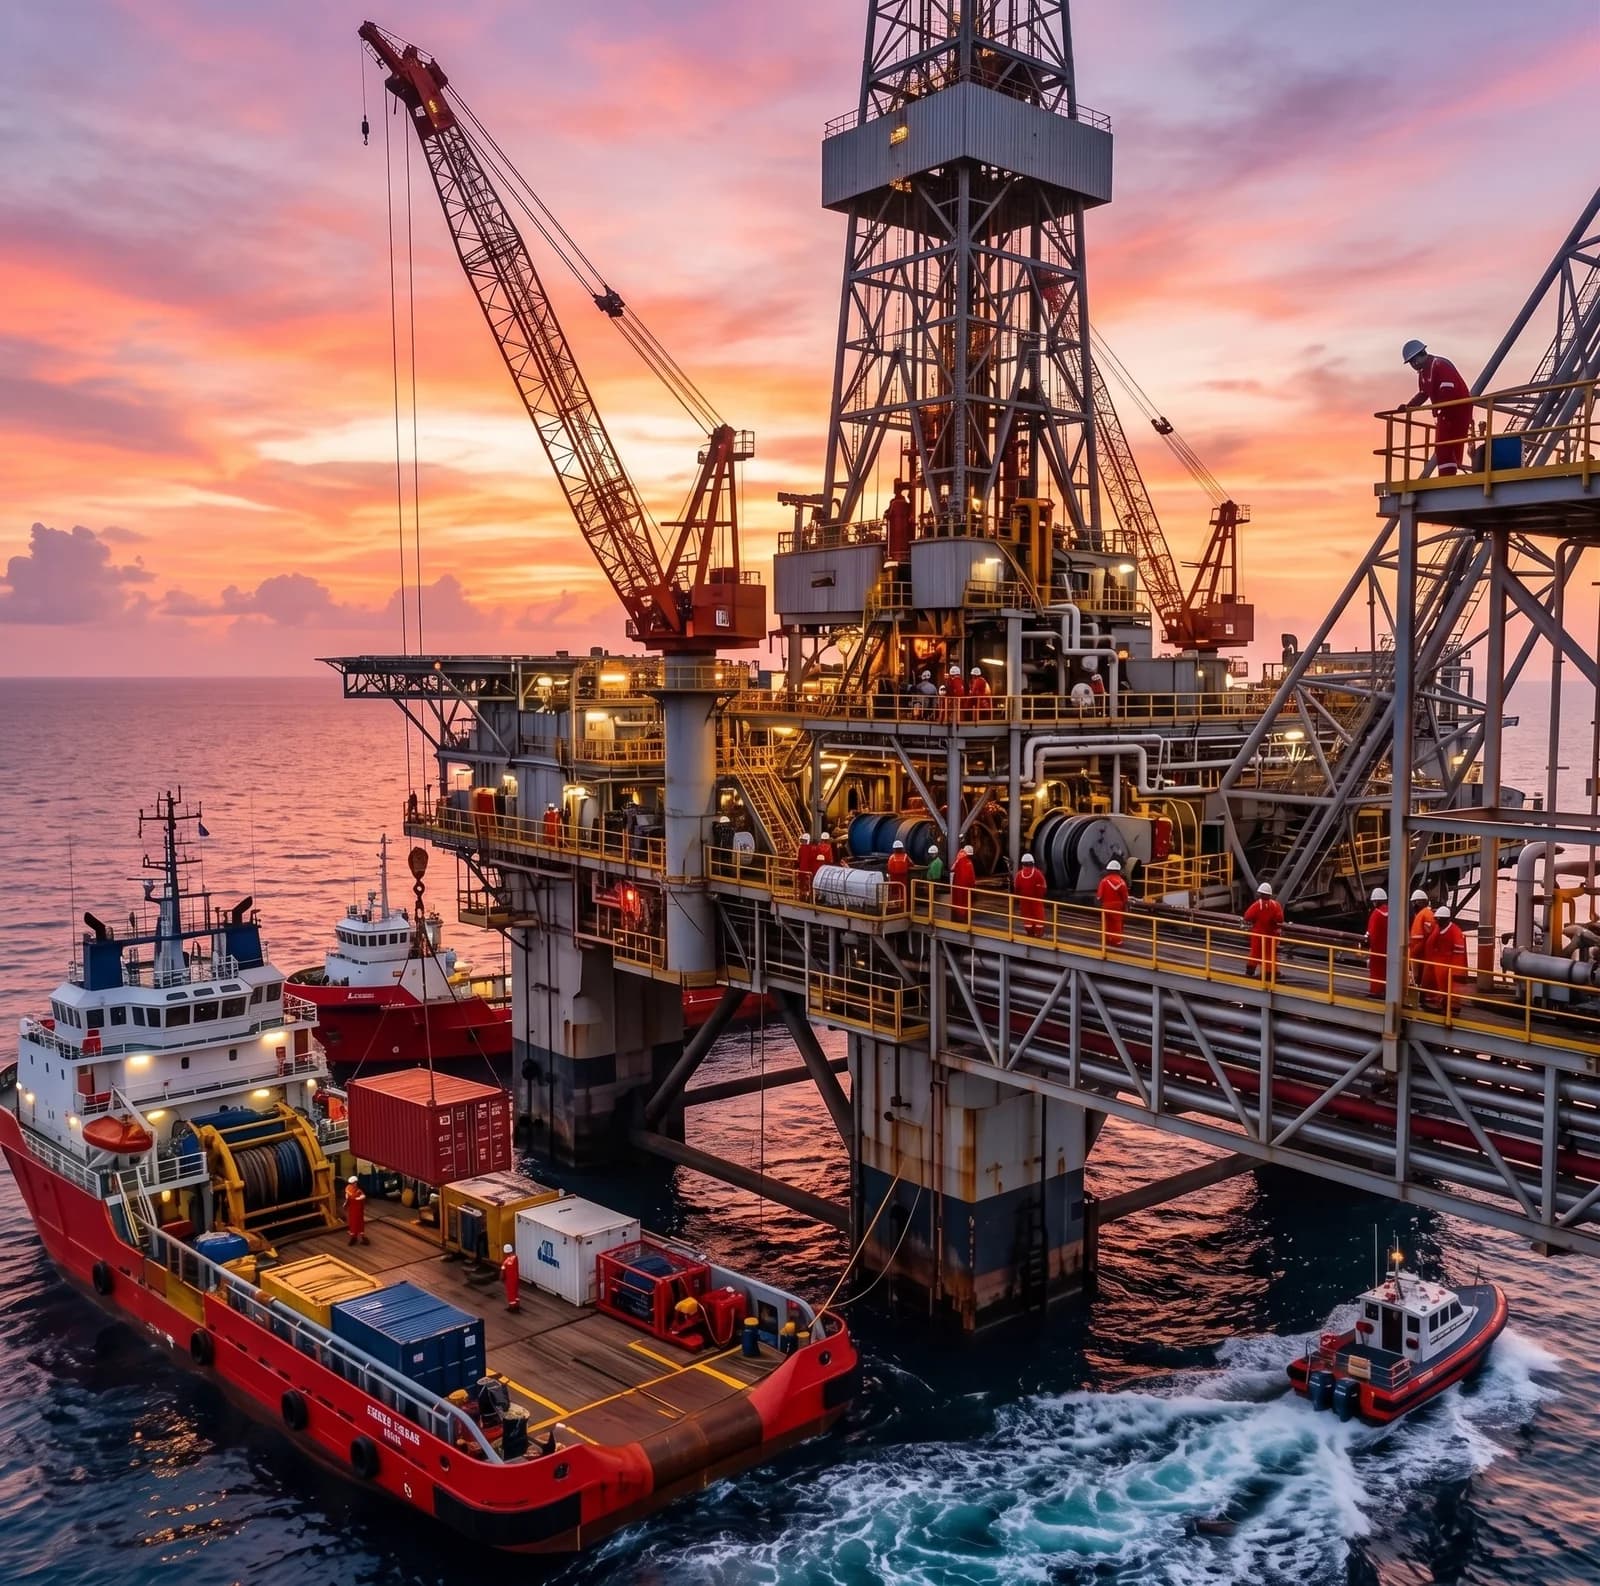
Oil & Gas
Flaring, fugitives, and a portfolio that isn't all producing.
Portfolio · upstream + midstream
Flare intensity
1.9%
▼ 0.6 pp
Fugitive CH₄
12,900 t
▲ 4.2%
Producing sites
5 / 6
1 terminal excluded
Scope 1 total
332,580 t
▼ 3.1%
- Flare intensity tracked as its own indicator, not folded into a generic emissions line
- Methane decomposed from fuel-gas and process pathways, not lumped together
- Non-producing terminals excluded from intensity rankings by design
Cement
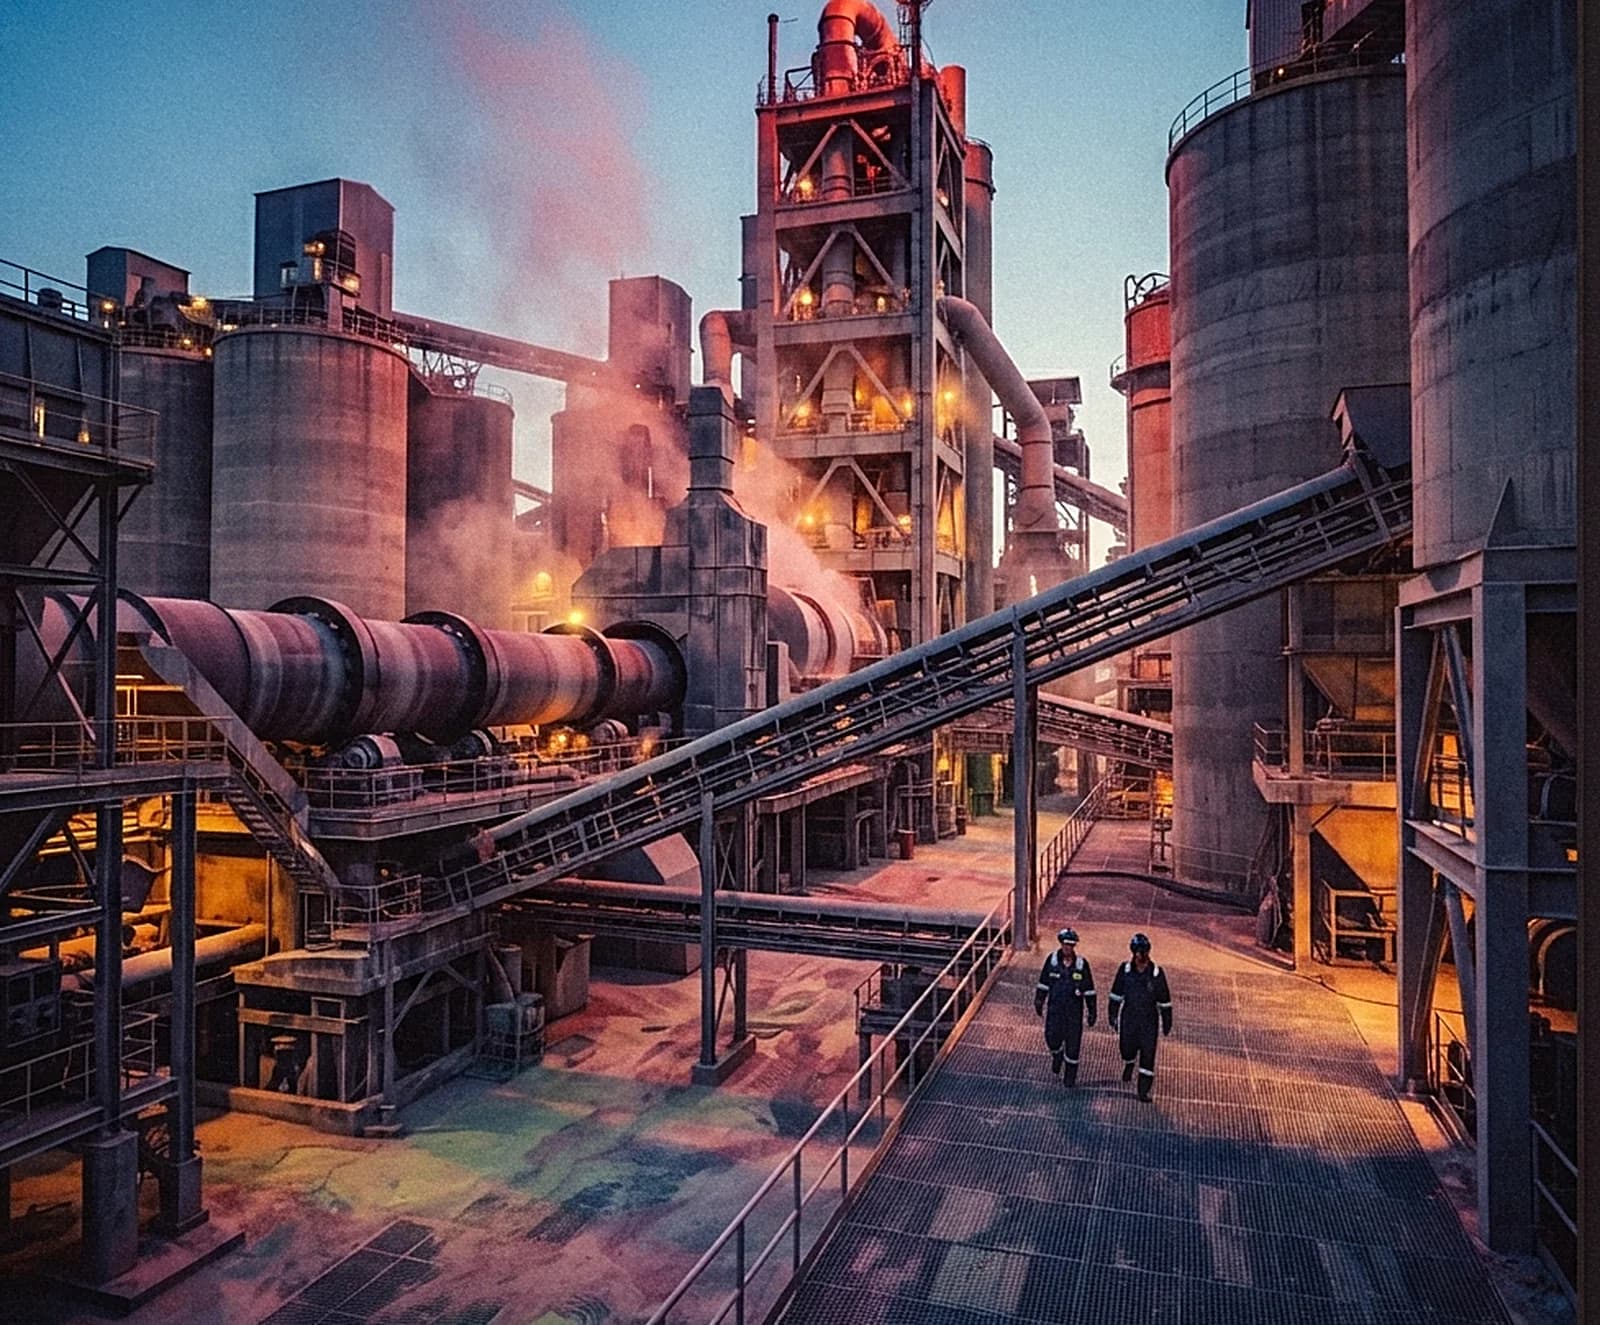
Kiln fuel mix, clinker factor, and emissions that aren't just about the fuel.
Kiln performance · this period
Clinker factor
0.72
▼ 0.03
Alt. fuel substitution
18.4%
▲ 3.1 pp
Specific thermal energy
3.4 GJ/t
▼ 0.1 GJ/t
Process CO₂ share
61%
of Scope 1
- Process emissions from calcination tracked separately from kiln fuel combustion
- Clinker factor and alternative-fuel substitution rate as first-class indicators
- Specific thermal and electrical energy per tonne of clinker, not just a site total
Steel & Metals
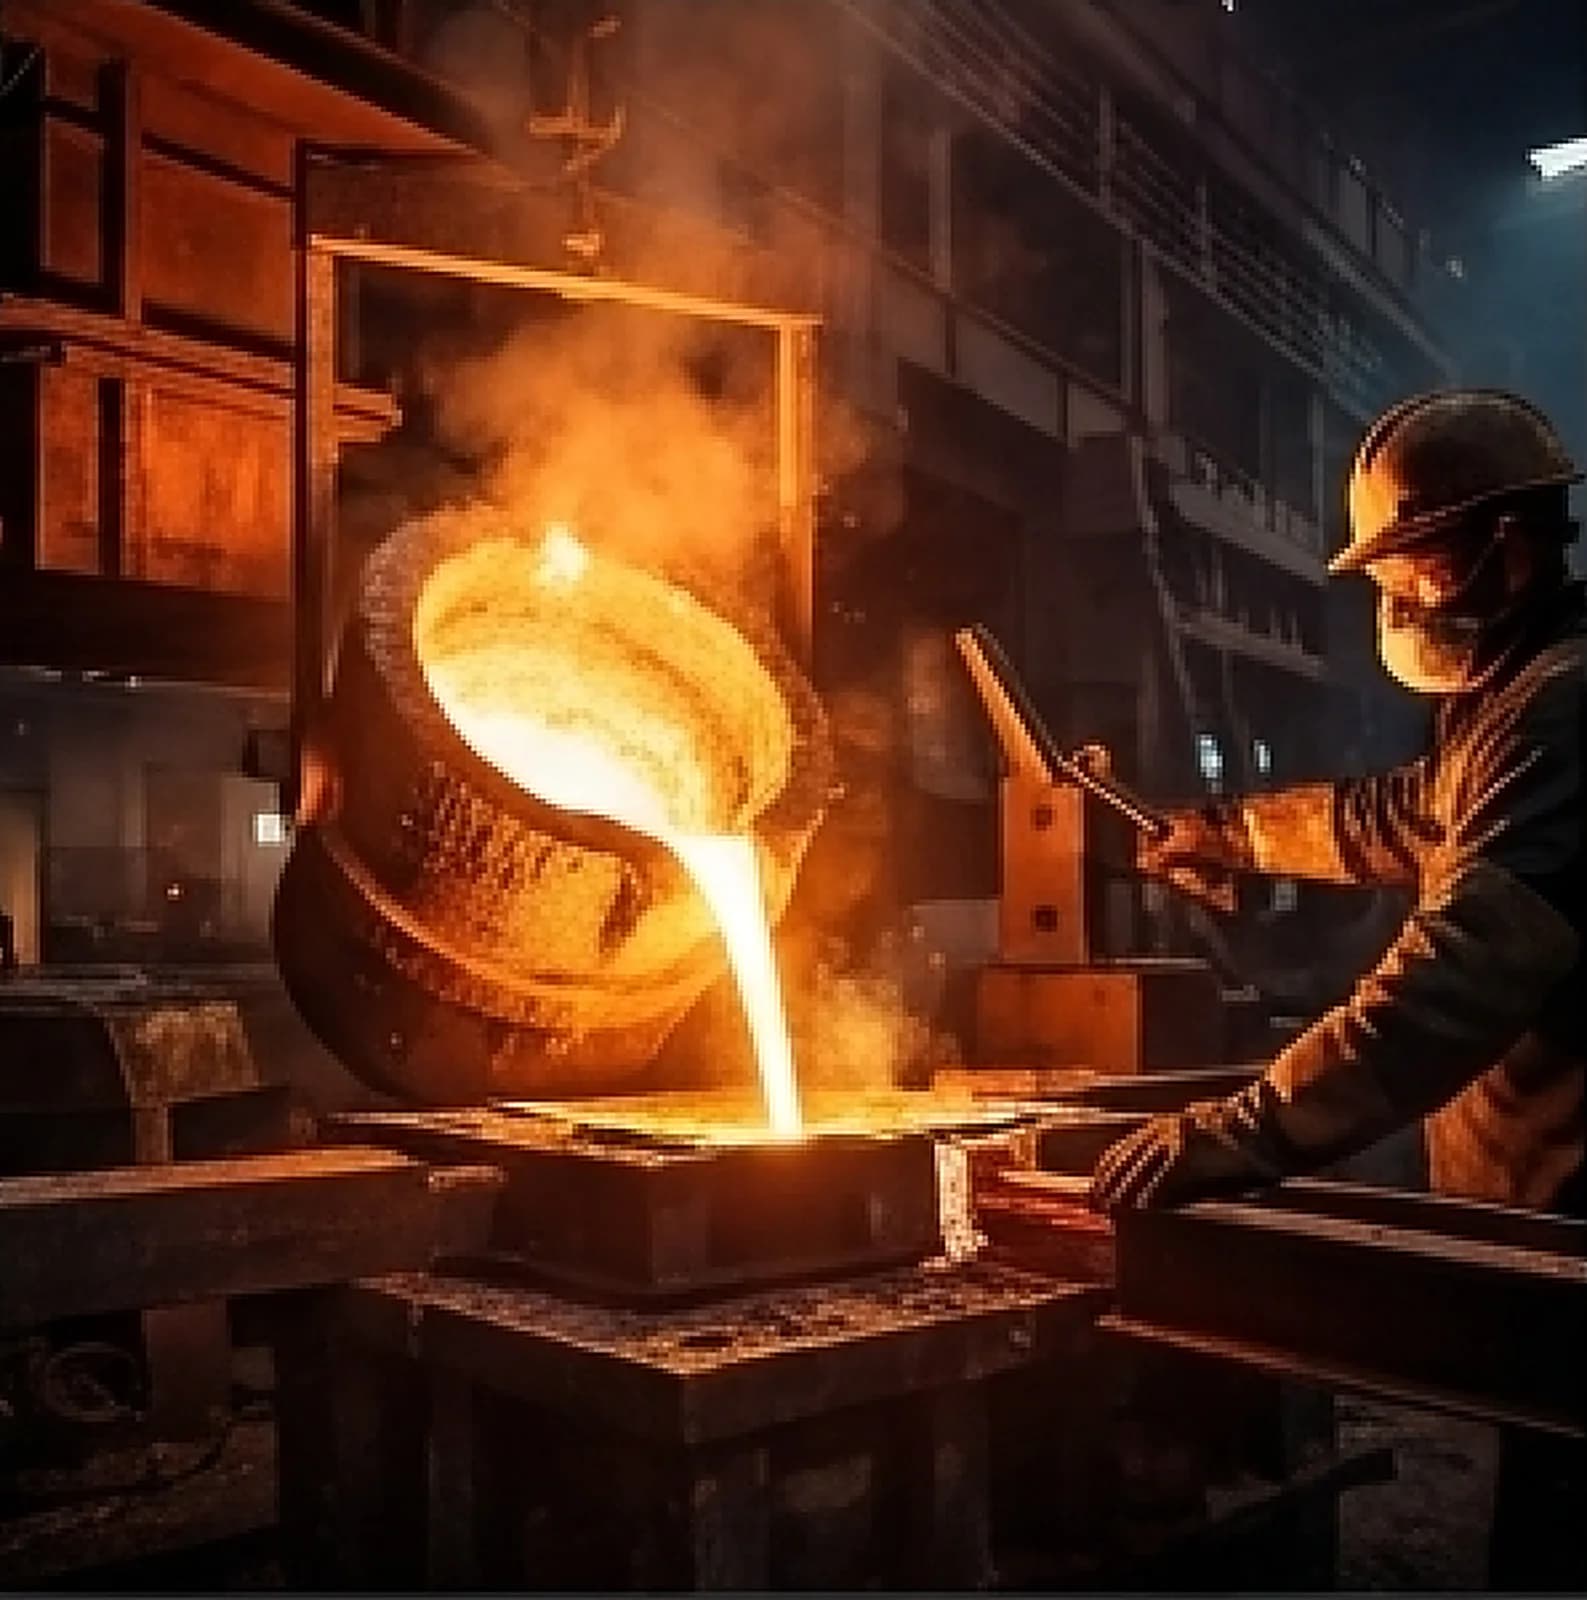
Route matters: electric arc and blast furnace don't share a baseline.
Route performance · by furnace type
Electricity (EAF)0.62 MWh/t
Fuel gas (reheating)1.1 GJ/t
Scrap charge ratio92%
Blast furnace coke rate480 kg/t
- Specific energy per tonne of crude steel, segmented by production route
- Scrap charge ratio tracked alongside energy — the two move together
- Electricity and fuel gas kept separate so an EAF site isn't compared to a blast furnace
Petrochemicals
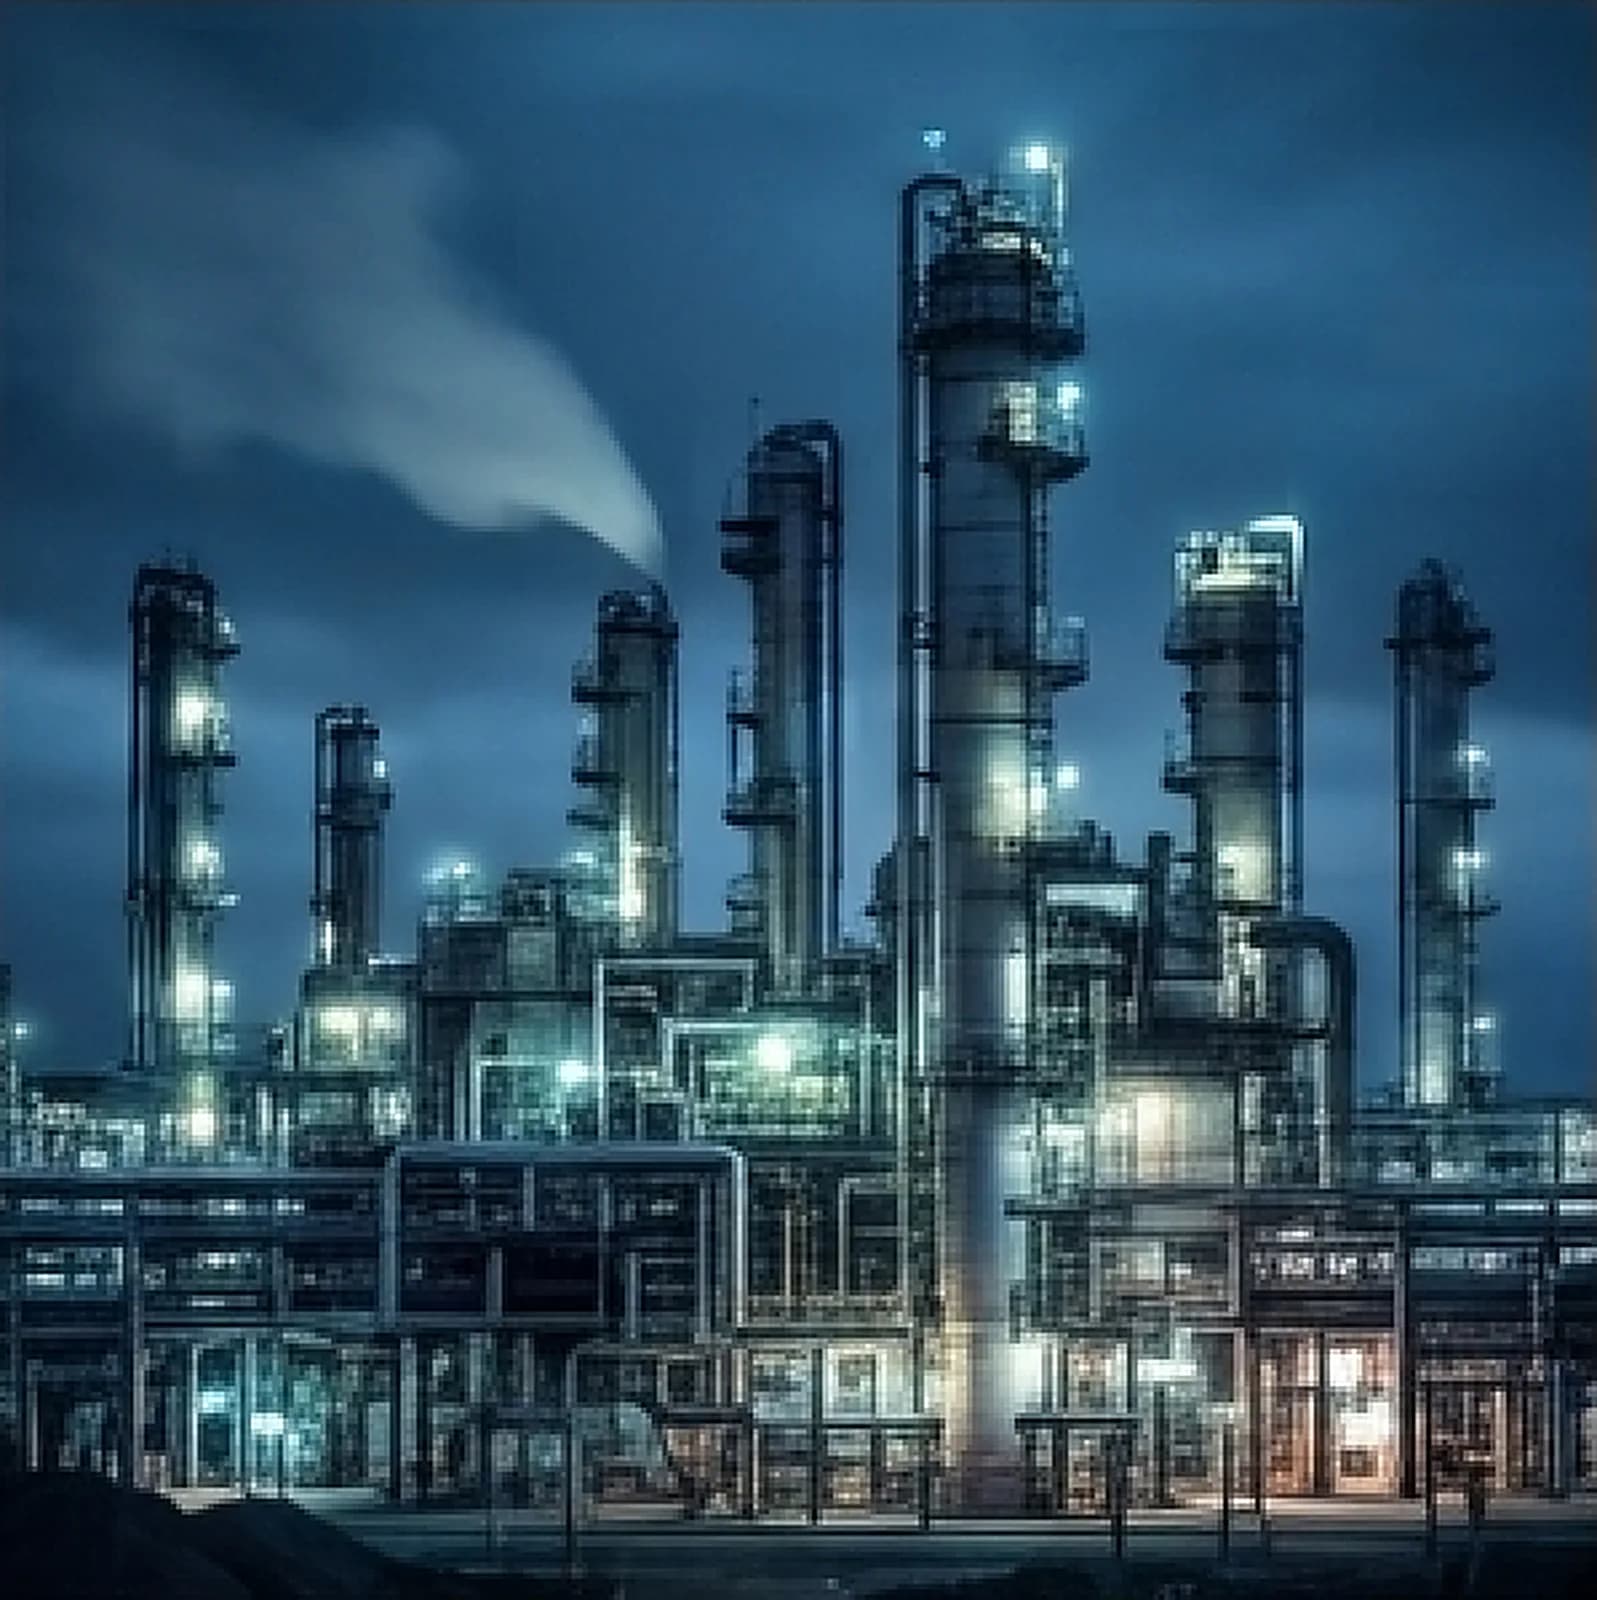
Process emissions and a refrigerant inventory that took years to get right.
Process emissions · by pathway
Process CO₂54,300 t
SF₆ / NF₃8,700 t
Refrigerants6,100 t
Fuel gas + steam39,200 t
- Process CO₂ tracked separately from combustion — different cause, different fix
- SF₆ / NF₃ and refrigerants at GWP-100, migrated in rather than rebuilt from scratch
- Energy flow shows steam and utilities consumption, not just fuel in / product out
Textiles
Wet processing is where the energy — and the water — actually goes.
Energy by stage · this period
Wet processing share
54%
of site energy
Steam intensity
1.8 t/t output
▼ 0.2
Electricity intensity
0.9 kWh/kg
▼ 4.6%
Boiler efficiency
81.2%
▲ 1.4 pp
- Energy split by stage — spinning, weaving, wet processing, finishing — not just a site total
- Steam demand tracked alongside electricity, since boilers usually dominate the fuel bill
- Water and energy reported together where wet processing links the two


Banks & Hospitals
Always-on buildings, where savings can't touch critical services.
Estate · by building type
Branch intensity
148 kWh/m²
▼ 6.2%
Data centre PUE
1.62
▼ 0.09
Cooling share
58%
of hospital load
Scope 2 total
21,400 t
▼ 4.8%
- Branches and hospital buildings benchmarked against their own type, normalised for operating hours
- Data centre and server-room efficiency tracked as its own indicator, including PUE
- Critical loads (generators, UPS, medical equipment) kept separate from what can safely be optimised
Real Estate & Facilities
A portfolio of buildings, each reporting on its own clock.
Portfolio · by building
Base-building load62 kWh/m²
Tenant sub-metered41 kWh/m²
Common-area share34%
Occupancy-normalised71 kWh/m²
- Energy per square metre benchmarked within comparable building types, not the whole portfolio at once
- Common-area and base-building load separated from tenant / sub-metered consumption
- Occupancy-normalised intensity, so a half-empty building doesn't look efficient by accident